Large projects in Codea - is it possible?

Does anyone have experience working on somewhat large projects in Codea (with dozen tabs and thousands of lines of code)? Is there a way to make it work?

I have discovered that at some point as the project grows Codea editor becomes basically unusable as it just freezes randomly for extended periods of time, up to the point where you spend half the time just waiting for it to unfreeze. I assume this has something to do with autosaving the project (if this is the case, can’t we have an option to only save it manually?)

Has anyone found a way to make large projects work in Codea editor? Any workaround? Will breaking up large project into multiple smaller ones and creating dependencies help?
Is it the number of tabs that’s the main problem? Is it the size of individual tabs? Any suggestion would be highly appreciated!

Codea is such an amazing tool, hands down best app I have on my iPad, such a shame the editor seems to have these limitations - especially given the fact that otherwise Codea appears to handle large projects just fine (oh, if only there was a way to actually code them :slight_smile: ).

P.S. I know, Codea was not intended as an environment for large projects, more for quick prototyping - still, it’s such a joy to be able to work on something of a reasonable size on an iPad…
@konaire - the iPad comes in many sizes both in screen and memory so you have to manage projects to be flexible, ‘require’ is an obvious way. Is your project something only you will use or are you planning to publish it ?

I used to code on the old BBC which enabled you to run projects from a base project or other, closeable, project liberating memory. The command used was ‘chain’ so you could step through several projects phases devoting the bulk of the kits capabilities to the current active section. Is that possible with iOS @sim @jfperusse @John ?

Thanks for the reply, @Bri_G !

I’m on 5th gen iPad Pro. The project is something that I would like to keep the option to publish (although that’s not the main intention), which is also why I have avoided dependencies as I recall reading a long time ago that they don’t work with AppStore submissions (don’t know if that’s still the case).

Can you elaborate a bit on ‘require’?

Most of my projects I make are large projects like this: https://www.youtube.com/shorts/ZiLTQTlBEkM

It work pretty well. I am currently making an editor for Codea so I made a massive ui pack with textInput, scroll area and bar, grid layout, and much more.

Codea works well also Codea is updating the their editor to allow for larger project.

Thanks, @Dinoball901 , that’s encouraging! Out of curiosity, how big is your project in terms of number of tabs/lines of code? You don’t experience any issues with the editor? No lag or freezes? Which iOS are you on?

Inside the project there are 23 tabs but it also require (imports from) other project like my gui pack which has about 30 tabs, also the animator has 2 tabs, tiled loader is 6 tabs, and more. So about nearly 70 tabs are used in the project but maybe about 35 is directly used.

I don’t experience freezing since I optimized the code pretty well, when I didn’t it was freezing but now it works great. Though sometimes can Codea but you don’t lose any work and you can open it back quickly.

1 Like

@Dinoball901 - neat video, I’ve seen images of that project before. Out of curiosity what kit are you running it on - iPad and external keyboard ?

If so - what’s the spec on your iPad ?

1 Like

Interesting, @Dinoball901 , thanks! Also, nice project you have there.

Funny enough, mine is similar to yours in some ways. I only have a prototype without proper visuals, but it looks like this: https://youtu.be/plmPaZw4m18?si=mAIa7F0i-wQJxCnk

It is much smaller in size then yours, though, so the frequent freezes of Codea’s editor are quite frustrating… Just wondering what you’re doing differently if you don’t have any problems with a much larger project.

1 Like

I am using the iPad Pro m2 256 gb

Keyboard: Amazon.com

Mouse: Amazon.com

Though it seem that they removed the color I had for the mouse.

Wow that looks great.

I do have 2 questions:

How did you make the debugging graph?
Are you using Legacy(3.0) or Modern (4.0)?

@Dinoball901

Thanks. I use Legacy (mostly because I’m not familiar with changes in Modern). I don’t use any of Codea’s tools beyond vectors and sprites, though, as I took the same approach as you and built my own small engine.

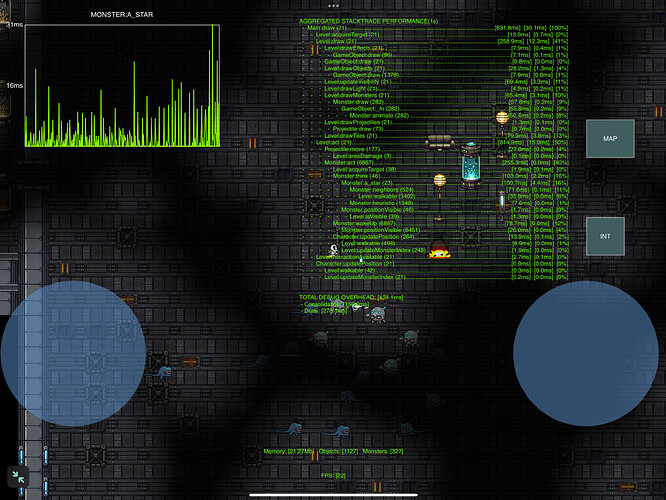
The debug graph is sort of a byproduct. With hundreds of objects/enemies and the pathfinding for each of them I’ve hit some performance constraints (with below 20 FPS in heavy scenes). I had to write a small custom debugger to track execution time across the stack trace and figure out what actually needs to be optimized. Without it I don’t know how I would get back to 60-100+ FPS I’m currently running at.

The attached screenshot basically shows what it does.

How did you draw the graph, also how did you get the memory?

It could be useful in my projects.

@konaire - very impressive, I like the graphics with the lightening bolts and the superimposed graph and other tools. You must spend a lot of time building that.

The M2 chipset showing its strengths there. How long before you release it ?

@Dinoball901 , the memory you can get by calling

collectgarbage("count")

On the graph - is your question how to get function execution time or how to actually draw it? For the execution time, you simply save the current time at the start of the function and calculate elapsed time at it’s end. In the simplest form:

function testRunTime()
    local startTime = os.clock()
    <…>
    local elapsedTime = os.clock() - startTime
end

I do it a bit differently - since I needed to track execution time for any arbitrary function, I calculate execution time in my small debugger (and also count number of times each function is called and aggregate it into the stack trace performance table in the screenshot above). I then use a wrap function to call the debugger - it also allows me to turn execution tracking on and off at will, since it’s by itself is quite demanding on performance.

This is roughly what it looks like:


function testRunTime()
    <…>
end

function DebugWrapFunction(_fn)
    return function(...)
        DEBUGGER:logTime(debug.getinfo(1).name)
        local result = {_fn(...)} 
        DEBUGGER:logTime(debug.getinfo(1).name)
        return table.unpack(result)
    end
end

function setup()
    if DEBUG_TRACK_PERFORMANCE then
        testRunTime = DebugWrapFunction(testRunTime)
    end
end

If your question is how to display the graph, then it’s pretty straightforward, here’s the code (the last 400 execution times for the monitored function are saved in self.archiveData, areaC1 contains the coordinates of the plot area bottom left corner):

function Debugger:draw()
    <…>
    if DEBUG_DRAW_EXECUTION_GRAPH then
        -- draw graph:    
        noFill()
        stroke(255)
        strokeWidth(2)
        rectMode(CORNER)
        rect(areaC1.x, areaC1.y, self.maxArchiveSize, height)
        stroke(137, 255, 0)
            
        local maxValue = 0
        for i=1,#self.archiveData-1 do
            local c1 = vec2(areaC1.x + i, areaC1.y + height*self.archiveData[i]/self.archiveScale)
            local c2 = vec2(areaC1.x + i+1, areaC1.y + height*self.archiveData[i+1]/self.archiveScale)
            line(c1.x, c1.y, c2.x, c2.y)
            if self.archiveData[i] > maxValue then maxValue = self.archiveData[i] end
        end
        self.archiveScale = maxValue
        
        -- captions for graph scale:
        fill(255)
        fontSize(14)
        text(string.upper(self.tracker), (areaC1.x+areaC2.x)/2, areaC2.y+20)
        text(string.format("%.0f", self.archiveScale*1000).."ms", areaC1.x - 20, areaC2.y)
        text(string.format("%.0f", self.archiveScale/2*1000).."ms", areaC1.x - 20, (areaC1.y+areaC2.y)/2)
    end
end
1 Like

@Bri_G , thanks for the kind words :slight_smile:

I’m not sure I will ever release it, it’s just something I’m doing for fun during my paternity leave - I’ve been at it a couple of hours a day for the last month. Getting it to publishable form will require much more work (and an artist, which I’m definitely not).

The most time I’ve spent so far was actually not on the graphics, but on what’s under the hood - procedural level generation, enemies decision making and pathfinding, optimization, etc. Besides, if I don’t find a solution for Codea editor freezes, the project is likely to become unfeasible to work on further.

Publishing would be a nice dream, though :smiley:

Hi @konaire!
I’m a bit late to the party but want to give you my perspective. You can create some pretty large projects within Codea. Check out WebRepo 2.0 - Easy access to projects from the Codea community (not iCloud compatible) for example :slight_smile:

Admittedly when you open the project in Codea it’s a minimal setup. The vast majority of the project (dependencies & sub-dependencies) is downloaded at runtime (and cached) before being loaded. All of the dependencies are also available on WebRepo.

On a dependency related note, when you submit a project to WebRepo (via the project) it uses the Packager project to automatically bundle any project dependencies. You can use it as a standalone project if you want to export or copy projects with dependencies.

I hope this gives you some added confidence to build even bigger projects!

2 Likes

Holy gazowie wow that looks great. Will it be on the App Store?

Planning to, first I want to make the editor then. Rebuild and continue this game in that editor.