i’ve started to work on FFT. Someone gave me some code 2 years ago, but i didnt really test it. Now i have sufficiently improved my codea skills to use it and test it. It seems to work great. Here is my test code:
https://gist.github.com/anonymous/97836a824e558fc72d79

Woot! I never understood that even when I took a course in it. Good old Professor Garner …
this is really neat. i bet the drawing could be sped up tho. 13FPS seems slow.
Fourier Transform finally made sense to me after i read a few chapters in DSPGuide.com’s book. I never understood how it worked, until the book explained that by multiplying each sample by the sin/cos at X frequency, you end up with the percentage of how much that frequency exists in that sample. There’s a fancy name for what that is called. I can’t remember it right now tho.
edit: the term is called “Correlation”
“The concept of correlation was introduced in Chapter 7. As you recall, to detect a known waveform contained in another signal, multiply the two signals and add all the points in the resulting signal. The single number that results from this procedure is a measure of how similar the two signals are.”
@matkatmusic fps: the graphics are here just to check things are ‘as i expect them to be’. So i didnt mind optimizing them. What i really want to do is image fft, then, i will work on fps.
Thanks.
nice! shame we cannot access the microphone, it would be fun to try and analyze sound input in realtime.
here is a more interactive version.
https://gist.github.com/anonymous/3e7a22c93abdbd4808f1
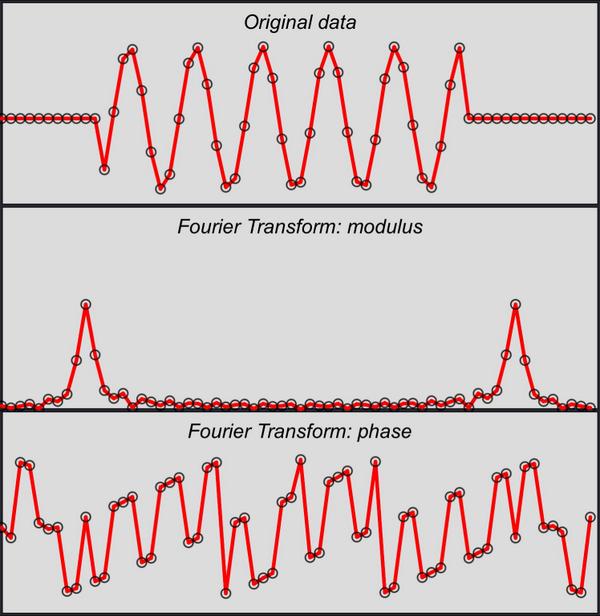
it lets you play with:
- the number of cycles (per data vector).
- a gate on the data.
It illustrates many important ‘keys’ about FT: the zero frequency, the fact that the peak modulus position is exactly your ‘number of cycles per support’, the special case of Nyquist frequency, the impact of gating more or less the signal. But this must come with oral explanations too.